The Fed is behind the curve, the bond market is saying, and it’s going to hike belatedly starting later this year, whether it wants to or not.
By Wolf Richter for WOLF STREET.
The US government sold $742 billion of Treasury securities last week, spread over 10 auctions. Of these auction sales, $504 billion were Treasury bills, with maturities from 4 weeks to 26 weeks, most or all of them to replace maturing T-bills, and $238 billion were Treasury notes with maturities from 2 years to 7 years.
There had been a bit of a lull of T-bill issuance during tax season as tax receipts were flooding into the government’s coffers, swelling up its checking account, the Treasury General Account (TGA), to over $1 trillion. In response, the Treasury Department had reduced its T-bill auction sales. But that’s over. The TGA balance has dropped back to $850 billion, below the desired balance of $900 billion, and T-bill issuance has resurged to January levels.
Inflation rates accelerated further in April, with the Fed-favored PCE price index at 3.8%, nearly double the Fed’s target, and the Consumer Price Index also at 3.8%. And T-bill yields, though they have edged up, are now below the rates of inflation across the board.
| Type | Auction date | Billion $ | High Rate | Investment Rate |
| Bills 4-week | May-28 | 88 | 3.63% | 3.69% |
| Bills 6-week | May-26 | 88 | 3.62% | 3.69% |
| Bills 8-week | May-28 | 83 | 3.62% | 3.69% |
| Bills 13-week | May-26 | 92 | 3.60% | 3.68% |
| Bills 17-week | May-27 | 72 | 3.63% | 3.73% |
| Bills 26-week | May-26 | 80 | 3.65% | 3.77% |
| Bills | 504 |
The Fed’s FOMC meeting on April 29, and the press conference that followed, showed a sharply split Fed with hawkish dissents on ending the FOMC’s statement’s “easing bias”; dissenters wanted to replace it with a statement that would give an equal chance of the next move being a rate cut or a rate hike. In their public speeches since then, Fed speakers have further shifted hawkish.
The government also sold $238 billion of Treasury notes, including a regular 2-year note with a fixed coupon payment, and a 2-year Floating Rate Note (FRN).
The 2-year FRNs were sold at a “spread” of 0.103%, same as a month ago. Investors who bought them get an interest rate that resets every week, based on the yield at which the most recent 13-week T-bills were sold at auction. Plus investors get this 0.103% “spread” (discount margin).
| Notes & Bonds | Auction date | Billion $ | Auction yield | Spread |
| Notes FRN 2-year | May-27 | 28 | 0.103% | |
| Notes 2-year | May-26 | 79 | 4.07% | |
| Notes 5-year | May-27 | 80 | 4.18% | |
| Notes 7-year | May-28 | 50 | 4.29% | |
| Notes & bonds | 238 |
Bond market counts on multiple rate hikes, whether the Fed wants to or not.
For example, the fixed-rate 2-year Treasury notes sold at a yield of 4.07%, the highest auction yield since February 2025, which was three rate cuts ago, when the Fed’s target range was still 4.25-4.50%, and the 2-year auction yield (4.169% at the time) was below the target range, implying future rate cuts, which came later in the year, three of them.
Now the Fed’s target range is down to 3.50-3.75%. And the 2-year auction yield was 4.07%, with buyers expecting at least two rate hikes in the first portion of the 2-year term.
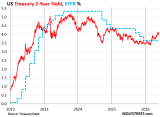
In the secondary market, the 2-year yield has been a good predictor of rate hikes and rate cuts. Late last year, it pivoted from more rate cuts to a hold. And in March it pivoted from hold to multiple rate hikes.
In the past week, the 2-year yield backtracked on the steep gains in the prior week and ended at 4.01%. The dotted blue line shows the Effective Federal Funds Rate (now at 3.63%), which the Fed targets with its policy rates.
The 26-week (6-month) Treasury yield moved above the EFFR at the beginning of March and has been at around the upper end of the Fed’s target range (3.75%) since mid-March, showing that the bond market sees a substantial chance of a rate hike within four to five months – so later this year.
Rate hikes, yes, but not in June and July. The 3-month Treasury yield, which offers a good window of rate expectations in the first two months or so of its three-month window, has been near the middle of the Fed’s target range right at the EFFR, though it has come up a little from late last year and earlier this year.
So some hawkish talk at the June and July FOMC meetings, but no rate hike, they’ll have to wait till later this year, that’s what the bond market expects.
The 10-year Treasury yield declined by 11 basis points during the week and ended Friday at 4.45%, having backtracked on some of the prior increases, in the eternal bond-market yield-yo-yo.
For long-term debt, inflation can be devastating if the yield is too low and doesn’t compensate the holder for the loss of purchasing power plus some. And given the current inflation, and the Fed’s reluctance to deal with it, this yield indicates that the bond market is still delusional about inflation in the future.
Higher yields mean lower market prices for existing holders of longer-term securities, and that part of the bond market, a huge part of it, doesn’t want yields to rise; they want yields to fall to obtain higher market prices for their securities. That’s the direction they’re pushing. It’s only buyers that want higher yields (lower prices).
The longer end of the bond market has completely blown off the Fed’s rate cuts.
The 30-year Treasury yield has been dancing around the 5% line since early April, going as high as 5.18% two weeks ago, and then backtracking some. On Friday, it closed at 4.99%.
I drew this imaginary trend line that connects some of the lows: a five-year trend of higher lows, amid a narrowing of the yield-yo-yo as the bond market has been getting a little less uncertain about where this is going.
Enjoy reading WOLF STREET and want to support it? You can donate. I appreciate it immensely. Click on the mug to find out how:
Yet the market marches higher. Wonder how this will all play out with the upcoming wave of refinancing of debt that was taken out during the COVID days, when rates were historically low. Private credit and equity comes to mind. And the overvalued market will be competing with treasuries and bonds with higher yields. War better finish up soon and oil drop. In the meantime SpaceX IPO is coming, so we’ll be distracted with that for a little bit. I am sure there will be a line a dupes ready to buy it up.
If Exxon and Chevron CEO’S are right
by end summer we ought to have $8 gas and $10 diesel
They surely would love that, those manipulative effing liars. Rip everyone off and make huge bonuses in the process.
At least with oil, you get something useful. It’s the insurance companies that are really ripping us off Wolf.
Says something about those in political power then that they put an Exxon CEO in charge of matters of state.
So we’ve gone from electric vehicle incentives to ICE vehicle penalties.
I feel bad for the passive index investors that might get caught up in these tech IPOs. Those index rules changes are really evil to a group of investors that were trained to autopilot and may be pushed to backstop VC exit on some very risky bets.
I have 0 concerns over the folks that want to speculate on Musk. This is America! If you want to gamble on “the future” pulled forward by a drug addled guy with too many baby mommas, then go for it and we’ll see what pain the future brings.
Good one Nate:
Raised where the circus wintered, I have never been able to see other than the VAST hyperbola/ PR nonsense from SO many of these kinds of folx…
John Ringling North, in spite of his inheritance, might be an exception, based mostly on the wonderful artifacts he and his family left for us to continue to enjoy to today…
Maybe, just maybe, these current cowboys, might somehow to arrange to do the same for the education and entertainment going forward, as least as well as did Carnegie.
Still, Jeff Bezos was first to sending his wife to space. Beat that, Musk.
The problem for Jeff, of course, was that she came back from space…
What’s imaginary about the trendline? Looks good to me.
The only thing that is imaginary is the Fed’s 2 percent inflation target.
Wouldn’t mind getting 6% on a CD again.
WSJ says Walsh is interested in the trimmed inflation mean, which what, ignores reality?, and suggests everything is fine at 2.3% climb.
1. Warsh mentioned only looking at “trimmed mean” inflation measures in general, not the Dallas Fed’s, to see underlying inflation trends. The Dallas Fed’s measure is asymmetrical. But the symmetrical trimmed mean measure runs close to core PCE right now. See the WSJ article!!! It even has a chart to show it.
2. Warsh never said that he wants to use a trimmed mean index as yardstick for the 2% inflation target, but only to see the underlying trends of inflation (accelerating or cooling) as a better predictor of future actual inflation.
3. He said that he wants better inflation measures based a “billion prices” collected with modern methods, and those would have to be produced by the BLS or the BEA, not the Fed. Our inflation indices (PCE and CPI) are flawed, especially their OER components and the health insurance/healthcare components, their flaws are frustrating, and improvements and modern methods would be welcome.
4. Trimmed mean measures reduce the impact of outliers both up and down, and the theory is that they might give a better idea of the directional trend of underlying inflation (accelerating or cooling) of actual inflation in the near future (forward looking).
5. Trimmed mean inflation measures are NOT used as a measure of actual inflation but of underlying inflation trends. Core PCE and core CPI fall into the same category. They don’t measure actual inflation but underlying inflation trends beyond the most volatile components. The all-items PCE and CPI measure actual inflation.
6. Before 2021, even the asymmetrical Dallas Fed’s trimmed mean inflation measure was mostly HIGHER than core PCE. For example:
June 2020: core PCE 1.0%, Dallas Fed’s index 1.8%
June 2019: core PCE 1.7%, Dallas Fed’s index 2.0%
June 2018: core PCE 1.9%, Dallas Fed’s index 1.9%
June 2017: core PCE 1.55%, Dallas Fed’s index 1.68%
7. But by excluding what were initially the outliers, and due to its asymmetric design, the Dallas Fed’s index was slow in catching on to the inflation spike in 2021, and it might have been in part responsible for the Fed not reacting to the surge of inflation because they have always looked at the Dallas Fed’s measure, it’s one of the Fed’s own derivative of the PCE index, and it’s not new, and they might have been misled by it, and Warsh has hammered on the Fed for not reacting to inflation sooner.
Bond market bets on rate hike.
I am not so sure Wolf. I hope I am wrong.
Just read article in WSJ that Kevin Warsh favors Dallas Feds “trimmed mean inflation rate” instead of “core inflation” data. I don’t want to go in details on how this inflation is calculated as article does a real good job but long story short, Dallas fed data is pointing towards inflation going down. Surprise Surpirise!!
Warsh is in favor of looking at this Dallas data and clearly building case that this inflation is just temporary and rate hike is not needed.
Obviously, you did NOT read the WSJ article. If you cite the WSJ article, make sure you read it, because that’s not what it said, and it’s not what Warsh said.
1. Warsh said no such thing, and the WSJ article was clear and explicitly stated that Warsh NEVER mentioned the Dallas Fed’s trimmed mean PCE inflation index, which is an asymmetrical inflation index based on the PCE price index, but mentioned only looking at “trimmed mean” inflation measures in general, not the Dallas Fed’s, to see underlying inflation trends. And the symmetrical trimmed mean measure runs close to core PCE right now. See the WSJ article!!! It even has a chart to show it.
2. Warsh never said that he wants to use a trimmed mean index as yardstick for the 2% inflation target, but only to see the underlying trends of inflation (accelerating or cooling) as a better predictor of future actual inflation.
3. He said that he wants better inflation measures based a “billion prices” collected with modern methods, and those would have to be produced by the BLS or the BEA, not the Fed. Our inflation indices (PCE and CPI) are flawed, especially their OER components and the health insurance/healthcare components, their flaws are frustrating, and improvements and modern methods would be welcome.
4. Trimmed mean measures reduce the impact of outliers both up and down, and the theory is that they might give a better idea of the directional trend of underlying inflation (accelerating or cooling) of actual inflation in the near future (forward looking).
5. Trimmed mean inflation measures are NOT used as a measure of actual inflation but of underlying inflation trends. Core PCE and core CPI fall into the same category. They don’t measure actual inflation but underlying inflation trends beyond the most volatile components. The all-items PCE and CPI measure actual inflation.
6. Before 2021, even the asymmetrical Dallas Fed’s trimmed mean inflation measure was mostly HIGHER than core PCE. For example:
June 2020: core PCE 1.0%, Dallas Fed’s index 1.8%
June 2019: core PCE 1.7%, Dallas Fed’s index 2.0%
June 2018: core PCE 1.9%, Dallas Fed’s index 1.9%
June 2017: core PCE 1.55%, Dallas Fed’s index 1.68%
7. But by excluding what were initially the outliers, and due to its asymmetric design, the Dallas Fed’s index was slow in catching on to the inflation spike in 2021, and it might have been in part responsible for the Fed not reacting to the surge of inflation because they have always looked at the Dallas Fed’s measure, it’s one of the Fed’s own derivative of the PCE index, and it’s not new, and they might have been misled by it, and Warsh has hammered on the Fed for not reacting to inflation sooner.
What inflation? The Trimmed Mean PCE inflation rate over the 12 months ending in April was 2.3 percent.
I’m looking forward to when “super” trimmed mean PCE becomes the next evolution in measuring inflation to justify keeping the federal funds rate low.
Obviously, someone is spreading a huge amount of stupid internet BS.
1. Warsh said no such thing, and the WSJ article was clear and explicitly stated that Warsh NEVER mentioned the Dallas Fed’s trimmed mean PCE inflation index, which is an asymmetrical inflation index based on the PCE price index, but mentioned only looking at “trimmed mean” inflation measures in general, not the Dallas Fed’s, to see underlying inflation trends. And the symmetrical trimmed mean measure runs close to core PCE right now. See the WSJ article!!! It even has a chart to show it.
2. Warsh never said that he wants to use a trimmed mean index as yardstick for the 2% inflation target, but only to see the underlying trends of inflation (accelerating or cooling) as a better predictor of future actual inflation.
3. He said that he wants better inflation measures based a “billion prices” collected with modern methods, and those would have to be produced by the BLS or the BEA, not the Fed. Our inflation indices (PCE and CPI) are flawed, especially their OER components and the health insurance/healthcare components, their flaws are frustrating, and improvements and modern methods would be welcome.
4. Trimmed mean measures reduce the impact of outliers both up and down, and the theory is that they might give a better idea of the directional trend of underlying inflation (accelerating or cooling) of actual inflation in the near future (forward looking).
5. Trimmed mean inflation measures are NOT used as a measure of actual inflation but of underlying inflation trends. Core PCE and core CPI fall into the same category. They don’t measure actual inflation but underlying inflation trends beyond the most volatile components. The all-items PCE and CPI measure actual inflation.
6. Before 2021, even the asymmetrical Dallas Fed’s trimmed mean inflation measure was mostly HIGHER than core PCE. For example:
June 2020: core PCE 1.0%, Dallas Fed’s index 1.8%
June 2019: core PCE 1.7%, Dallas Fed’s index 2.0%
June 2018: core PCE 1.9%, Dallas Fed’s index 1.9%
June 2017: core PCE 1.55%, Dallas Fed’s index 1.68%
7. But by excluding what were initially the outliers, and due to its asymmetric design, the Dallas Fed’s index was slow in catching on to the inflation spike in 2021, and it might have been in part responsible for the Fed not reacting to the surge of inflation because they have always looked at the Dallas Fed’s measure, it’s one of the Fed’s own derivative of the PCE index, and it’s not new, and they might have been misled by it, and Warsh has hammered on the Fed for not reacting to inflation sooner.
EFFR is below 6M, 1Y, 2Y, 5Y, 10Y and 30Y. In the next 10 years:
10Y x $40T gov debt x (-) 2% = (-)$8T. Recession risk is low. If inflation rises above 12%/15% the Fed knows how to fix it. Let the banks create credit in the private sectors. A smaller gov, tariffs, higher income and payroll tax collection and negative rates can fill the TGA. Export of cars and industrial goods from Canada and Mexico are falling. Mexico is in cyclical slow down but not in recession. Canada is the weakest link.
Bond market seems to be thinking that we’ll have another late Fed, with perhaps some over-tightening in response once inflation gets out of control. In other words, post-Covid, again.
At least that’s how I can make some sense of the 3-mo vs. the 10-year.
Personally, I think this is a bit too blase. I think we have a material risk of inflation being embedded with the ongoing unwinding of the globalization/China supply chains, which appear to be consistently deflationary in hindsight.
Adding a billion workers, without collective bargaining authority (because, rejoice, workers of China, the CCP is YOUR union to no strikes are allowed!) and a state-subsidized export scheme for industrialization without consumption probably was what let central banks do whatever they wanted with monetary policy.
Oil shock certainly didn’t help but I think the low rates 2% regime is probably a thing of the past. Eventually long-term bond holders are going to demand better real returns.
Don’t be surprised if they don’t raise rates.
They may wait until right on the mid terms.
The China comment is interesting, but it’s important to note this is an unwinding of China, not globalization. Most of those manufacturing jobs lost to China are shifting to Vietnam, North Africa, Indonesia Mexico, etc rather than back to Western Europe, Japan, South Korea or the US, where they have been lost from in roughly that order. If anything, it’s more of a broadening of the geographic scope of globalization than going back to internal production.
I’d say the housing market is on the bond market / interest rate precipice. That is, interest rate increases cannot be beneficial to the housing market.
The housing market is overdue for some corrective medicine -the other day the NY Post showed an 1140 sf boarded up ‘outhouse’ (shack) in Torrence, CA sell for over $ 1 Million. Yes, our friend Wolf will say it’s the land that provides the value, not the actual house. Well, that land is likely 10x overvalued.
I would welcome and love to see 15% + interest rates. Sweet, sweet medicine, indeed!
What TACO does in Iran will determine what the Fed does. If bombs start dropping again, we may well see a July rate hike. If he approves a 2-3 month negotiating window, then the Fed can wait until Sept (maybe).
I agree with the OER / healthcare boondoggle. Warsh, IMHO, would have a lot of credibility, if he’d just come out and state the obvious that these measures need to be fixed with meaningful measures el pronto.
One can wish, I suppose.
Dude what they are doing in Iran is RAISING OIL PRICES!!
that is all they are doing.
It benefits a few and screws over the rest of us.
@sufferinsucatash when you say “It benefits a few and screws over the rest of us.” it seems like you (like a lot of people) are over focused on gas prices. I use about 40 gallons of gas a month so when the price goes up by $1 that is another $40/month expense. I’m not happy gas has gone up by $40/month but it seems like food has gone up by $40/week in recent years.
Apartment, Gas prices going up make everything go up.
America is business, they are going to pass that cost to you.
If you are an apartment investor, as name implies, then companies fixing your apartments will charge you more. More money out of your business (if you do have a business). You then have to try to pass that on to your tenants, who are stretched from paying for gas for work/life.
It’s a cascading problem, and if you don’t care, then politics may have you wearing some rose colored glasses.
Also I drive a lot.
Maybe the Chicago Fed’s trimmed inflation measures make more since than the Dallas version. It is symmetrical and only trims about 16% at each end of the outliers.
“There are 100,000,000,000 stars in the galaxy. That used to be a huge number. But it’s only a hundred billion. It’s less than the national debt! We used to call them astronomical numbers. Now we should call them economical numbers.” – Richard Feynman, 1987
So… Last week the Treasury borrowed $742 billion … that’s enough money to send either $5 or $10 to every star in the galaxy. Every week.
It’d give a whole new meaning to “Universal” “basic income”, if we gave money to every star in the Universe!
Your comment made me think that a new paradigm is in play.
The economy is now controlled by many players – the Fed, Congress, the President, corporations, the ultra-wealthy…
Old metrics are meaningless.
I think it is just the ultra wealthy running the show’s mechanics, the economy and the aspirational take their marching orders from them…..until…. the pitchforks come out. Then, all we’ll hear is “we had no idea”, “not me”, “no one could ever”…..
Rates will be higher to counter inflation, and if the Straits effect is too debilitating on the World’s economy rates will be battling stagflation. The system is taking a pretty hefty shock right now with no end in sight.
Long rates are all over the place because people have no idea where the future is going. Tariffs? War? Oil shortage? Employment? AI?
Nobody’s got a clue.
I mean, I’m not dropping real money to read some pundit wankfest (read wsj), and rather than dropping money there I sent a donation here.
If you just take what Warsh said at face value he does seem to be indicating that inflation is headed in the right direction if you use these trimmed mean measures. And nearly every outlet and a lot of economic institutions are saying it’s his preferred method.
So maybe everyone except wsj are full of shit. And maybe warsh is just interested in great economic policy and laser focused (wank wank) on crisp accurate numbers, but you’d be hard pressed to not call him a partisan, and he isn’t lacking political savvy. So maybe, just maybe the trimmed mean thing is just cover to do his patrons bidding. Or you know I could still just be his real opinion, bro.
Reading the data isn’t always a perfect window on the present, much less the future. But economic outcomes do accrete so people are reasonable to be wary.
Warsh may do this or he may do that. It doesn’t matter as the bond market has the final say.
If he doesn’t raise rates, he’s going to lock sticky inflation in and he’ll end up being labeled another Arthur Goldberg.
They had a chance to make the economy boom but they blew it. They should have raised taxes on the wealth not cut them. They did the opposite of the medicine required.
We have price bubbles in everything now and and some point, it’s all going to end very badly.
There are 12 voting members on the FOMC, including Warsh. He has to persuade a majority to follow his point of view. Alone, he cannot do anything except dissent, and that would instantly kill his credibility.
Yes, but Warsh is the guy that the Pres. will crap on. And Powell and a few others will be under investigation. They do what the Boss wants. Bessent, DOJ, congress, Supreme Court, they cave. We will see if Warsh has a backbone. He does seem to be a good spinner and BSer.
What do you think about the price of oil. Seems low to me. I know they say there has been some demand destruction, but could it be signaling an economic slowdown?
The price of oil is low for you, but it’s high given that the US is awash in oil and has cranked up exports.
The modern Federal Reserve’s reaction function:
~2% PCE (last seen in January 2021): their “official” target, at least what they publicly say it is
~3%: Easing bias. “We’re concerned about the labor market.”
~4% (we’re here as of May 2026): We see some two-sided risk.. but monetary policy is well-positioned right now to react to economic developments.”
~5%+: maybe this level is high enough for most of committee to be on board with rate increases?
Exactly
The Fed lives BEHIND the curve……and seems to enjoy it.
Slow to raise, quick to cut.
Regarding the WSJ article and Warsh….
“Warsh’s position matters because it isn’t really about
one statistic, but how the Fed deals with the price
shocks that an era of tariffs and geopolitical disruption
may keep producing. Central bankers call this “looking
through” a price move—deciding any price pressure
isn’t worth a policy response because they expect it to
fade.”
“Looking through”, ie waiting, and perhaps misidentifying. That which is tagged “transitory” maybe not. Too much subjectivity, and the Fed always seems to err in the same direction.
“Financial Repression”. They want a higher inflation rate (3-4%) but will say otherwise. They will “control” most interest rates to be slightly below the rate of inflation. They will let the stock market continue to expand for “wealth effect” purposes but also because more money will move there to avoid bond market repression.
Kevin Warsh (and Scott Bessant) are the new/dual men behind the curtain, as it were. With all the knobs and dials and so forth to control this beast. The rest of the world knows all of this. China, Russia and Europe know what the US has to do. But none of them, except perhaps Russia, are interested in a collapsed US economy.
There are of course any number of black swans in the backgroud, but this could go on for a very long time.
Low real rates of interest lowers the personal savings rate in April to 2.6%
Trimming highly paid engineer cost. Meta, AMZN, MSFT, Googl might keep them on the payroll until Q4 2026/Q1 2027 at about $2 millions each. They might sell some of their high tech stocks and their $2 million SF area house, before they move on. They might have a second job, before the compensation package expires.
Wall Man is looking at me in a strange and unnerving way!
Lol
Get a beer mug,he will go away,guess I need to get another so at least have a matching pair!
Interesting discussion re : the new Fed chair methodology of inflation calculation .
That said , with no dog in the fight , it is interesting the Berkshire Hathaway just made a bid for Taylor Morrison Homebuilder, not the largest acquisition , but does suggest that their view is lower mortgage rates , no recession and no significant rise in unemployment ahead.
My my what a difference a day makes. 30 year blows back above 5%. War is “back on”.
Wolf says in response to Exxon and Chevron greed:
“They surely would love that, those manipulative effing liars. Rip everyone off and make huge bonuses in the process.”
I say, name me the corporate sector that doesn’t cohabit the WH and live incestuously with Congress? Remember the Nordstream war crime? Europe is paying triple for US LNG than it did for “Ruzzian” LNG…
Our “green” Governor in Hawaii just signed a law eliminating all solar tax credits in the State. He is also pushing for Hawaii to go “green” by converting the State to LNG based electricity in the midst of the worst energy crisis in US history.
“MILAN, Sept 11 (Reuters) – It may appear quite audacious for the world’s largest natural gas producer to demand that its biggest market stop buying from a competitor. But that’s exactly what unfolded this week at the global gas industry’s annual gathering in Milan.
Speaking at the start of the Gastech conference, U.S. Interior Secretary Doug Burgum delivered a clear message: Europe should stop purchasing gas from Russia, which the United States would happily replace.”
The ten year seems to have bottomed out last week and is back over 4.5%.
This is good. The market signal on US deficits and debt and Fed enabling needs to be much stronger. 5%+ would be good – along with meaningful QT. SHOW the bond market you’re serious about long term debt management (Treasury and Fed). No more dot plots and jawboning.
Rapid hiring led to rapid firing. Older Workers Benefit Protection force the high tech sector to offer L5/L6 engineers 6/8 months severance packages and with bonuses and restricted stocks units. When they sign they cannot transfer knowledge to other high tech co, but they can work in the defense industrial sectors for much less, in cheaper areas. They can liquidate $2/$3 million in stocks, sell their SF area house and get paid for 6/8 months for a total of $5/$10 millions. Another option is to wipe out a few projects, firing all their workers. Those young community colleges who grad in AI cannot buy their houses or pay rent, without a package
Even the 2% target must be considered a TAX on the holders of dollars
AND
under our system governance ONLY CONGRESS can pass taxes.
So let’s put the 2% “target” up for a vote in Congress and see how it does
Thats what people are voting for in elections from national to local. But the vast majority cant conceive of voting third party. Libertarian is the only choice for a balanced budget and if we cant stop deficit spending, forget about stopping inflation.
When oil prices go up, congress wants windfall taxes.
What about the tech companies. Their profit margins are insane. AI Memory, chip makers and etc profit margins have doubled making PCs and laptops for people more expensive. How about hitting them with a windfall tax.
Many are getting g tax payer money to build new plants. They don’t need tax payer money.
Because they lack a lobby compared to the oil barons.
Facts Only
The U.S. government sold $742 billion in Treasury securities last week, including $504 billion in Treasury bills and $238 billion in Treasury notes.
Treasury bill maturities ranged from 4 weeks to 26 weeks, with yields between 3.60% and 3.77%.
The Treasury General Account (TGA) balance dropped from over $1 trillion to $850 billion, below the desired $900 billion threshold.
Inflation rates in April were 3.8% for both the PCE price index and the Consumer Price Index (CPI).
The Federal Reserve’s current target range for the federal funds rate is 3.50-3.75%.
The 2-year Treasury note auction yielded 4.07%, the highest since February 2025.
The 26-week Treasury yield has moved above the Effective Federal Funds Rate (EFFR), signaling potential rate hikes.
The 10-year Treasury yield ended the week at 4.45%, while the 30-year yield closed at 4.99%.
Former Fed official Kevin Warsh has advocated for using trimmed mean inflation measures to assess underlying trends, not as a replacement for headline inflation targets.
The bond market expects multiple rate hikes, though not immediately in June or July.
Longer-term Treasury yields have shown volatility, with the 30-year yield fluctuating around 5%.
The Fed’s April FOMC meeting revealed divisions, with some members pushing for a more hawkish stance.
Executive Summary
The U.S. Treasury recently conducted $742 billion in securities auctions, including $504 billion in short-term Treasury bills and $238 billion in notes with maturities ranging from 2 to 7 years. This surge in issuance follows a temporary reduction during tax season, as the Treasury General Account (TGA) balance dropped from over $1 trillion to $850 billion, prompting renewed borrowing. Inflation remains elevated, with the Fed’s preferred PCE index at 3.8% and the CPI at 3.8%, both nearly double the Fed’s 2% target. Treasury bill yields, however, remain below inflation rates, with 4-week to 26-week bills yielding between 3.60% and 3.77%.
The bond market is signaling expectations of future Federal Reserve rate hikes, despite the Fed’s current target range of 3.50-3.75%. The 2-year Treasury note auction yielded 4.07%, the highest since February 2025, suggesting investors anticipate at least two rate hikes within the next two years. The 26-week Treasury yield has also moved above the Effective Federal Funds Rate (EFFR), indicating market expectations of a rate hike within four to five months. Meanwhile, longer-term yields, such as the 10-year and 30-year Treasuries, have fluctuated, with the 30-year yield hovering near 5%. Debates persist over inflation measurement, with some advocating for alternative metrics like trimmed mean inflation to assess underlying trends, though these are not intended to replace headline inflation targets.
Full Take
The bond market’s pricing suggests a growing conviction that the Federal Reserve will be forced into rate hikes later this year, despite its current cautious stance. This narrative is reinforced by the inversion of short-term Treasury yields above the Fed’s target rate, a historical precursor to policy tightening. However, the debate over inflation measurement—particularly the use of trimmed mean metrics—highlights a deeper tension: whether the Fed’s reliance on flawed or lagging indicators has contributed to its delayed response to persistent inflation. The market’s skepticism is further evident in the disconnect between long-term yields and rate cut expectations, with the 30-year Treasury yield hovering near 5%, reflecting doubts about the Fed’s ability to sustain low inflation without over-tightening.
The broader pattern here echoes post-2008 monetary policy dynamics, where central banks struggled to balance growth and inflation amid structural shifts like deglobalization and supply chain realignments. The article’s focus on Treasury auctions and yield curves also underscores the fiscal-monetary interplay: as government borrowing surges, the bond market’s demand for higher yields could force the Fed’s hand, regardless of its stated intentions. This raises critical questions: If inflation proves more embedded than transient, will the Fed prioritize price stability over financial market stability? And how might the unwinding of COVID-era debt—much of it issued at near-zero rates—amplify volatility in asset markets?
The commentary on inflation metrics and the Fed’s credibility is particularly noteworthy. The push for alternative measures like trimmed mean inflation, while framed as a tool for better trend analysis, could also serve as a rhetorical device to justify inaction. The historical context—where such metrics lagged during the 2021 inflation surge—suggests a risk of repeating past errors. Meanwhile, the bond market’s pricing of rate hikes reflects a bet that the Fed will, once again, be "behind the curve," a pattern that has defined its post-pandemic policy trajectory.
**Patterns detected: ARC-0024 Ambiguity (use of trimmed mean inflation as a potential evasion tactic), ARC-0043 Motte-and-Bailey (shifting between inflation metrics to justify policy flexibility).**
**Bridge questions:**
1. If the bond market’s rate hike expectations materialize, what sectors of the economy are most vulnerable to a policy-induced slowdown?
2. How might the Fed’s communication strategy evolve if it adopts alternative inflation metrics, and what risks does this pose for public trust?
3. What would it take for the Fed to regain credibility as an inflation fighter, and is the bond market’s skepticism justified by historical precedent?